THE COVERT EYE / WOOCOMMERCE INTELLIGENCE
01 — SEE THE UNSEENMarketing for
the Uncommon…
just got better.
Your store is talking.
See what it means. Know where to act.
THE COVERT EYE connects WooCommerce sales, shopper behavior, inventory, and customer value—so your next decision starts with evidence.
 THE COVERT EYE
SEE THE UNSEEN
The demand behind the clicks.
The patterns behind the purchases.
The opportunities hiding in plain sight.
THE COVERT EYE connects the signals across your WooCommerce store—so you can see beyond the sale and decide what comes next.
Bring it into focusTHE COVERT EYE / DATA IN FOCUS
Every signal.
A bigger picture.
A click becomes a journey. An order becomes a pattern.
Scroll to see what your store has been trying to tell you.
FIVE CHAPTERS. ONE CONNECTED STORE.
THE CONNECTED VIEW
One store.
The whole story.
Sales. Shopper journeys. Stock. Customer history. THE COVERT EYE brings them into connected workspaces—so you can follow the evidence, not hunt for it.
Sales + journeys + inventory + customer history
PATTERNS IN FOCUS
One store. Connected signals.
FEATURE ILLUSTRATION · DEMO DATA
Illustrative data, not a live dashboard. Estimates are not guarantees.
THE COVERT EYE surfaces the evidence. Your team takes the next step.
02 / FROM SIGNAL TO DECISION
More than a number.
A reason to act.
Orders tell you what happened.
Connected data helps you understand what to do next. Choose a scenario and follow the signal.
Compare managed stock with the pace of recent paid orders.
THE COVERT EYE surfaces the evidence and the opportunity. Your team makes the call.
03 / INSIDE THE COVERT EYE
Everything your store knows.
Finally, in view.
Explore the plugin’s actual workspaces. Open a dashboard at full size to inspect the detail—not just the headline numbers.
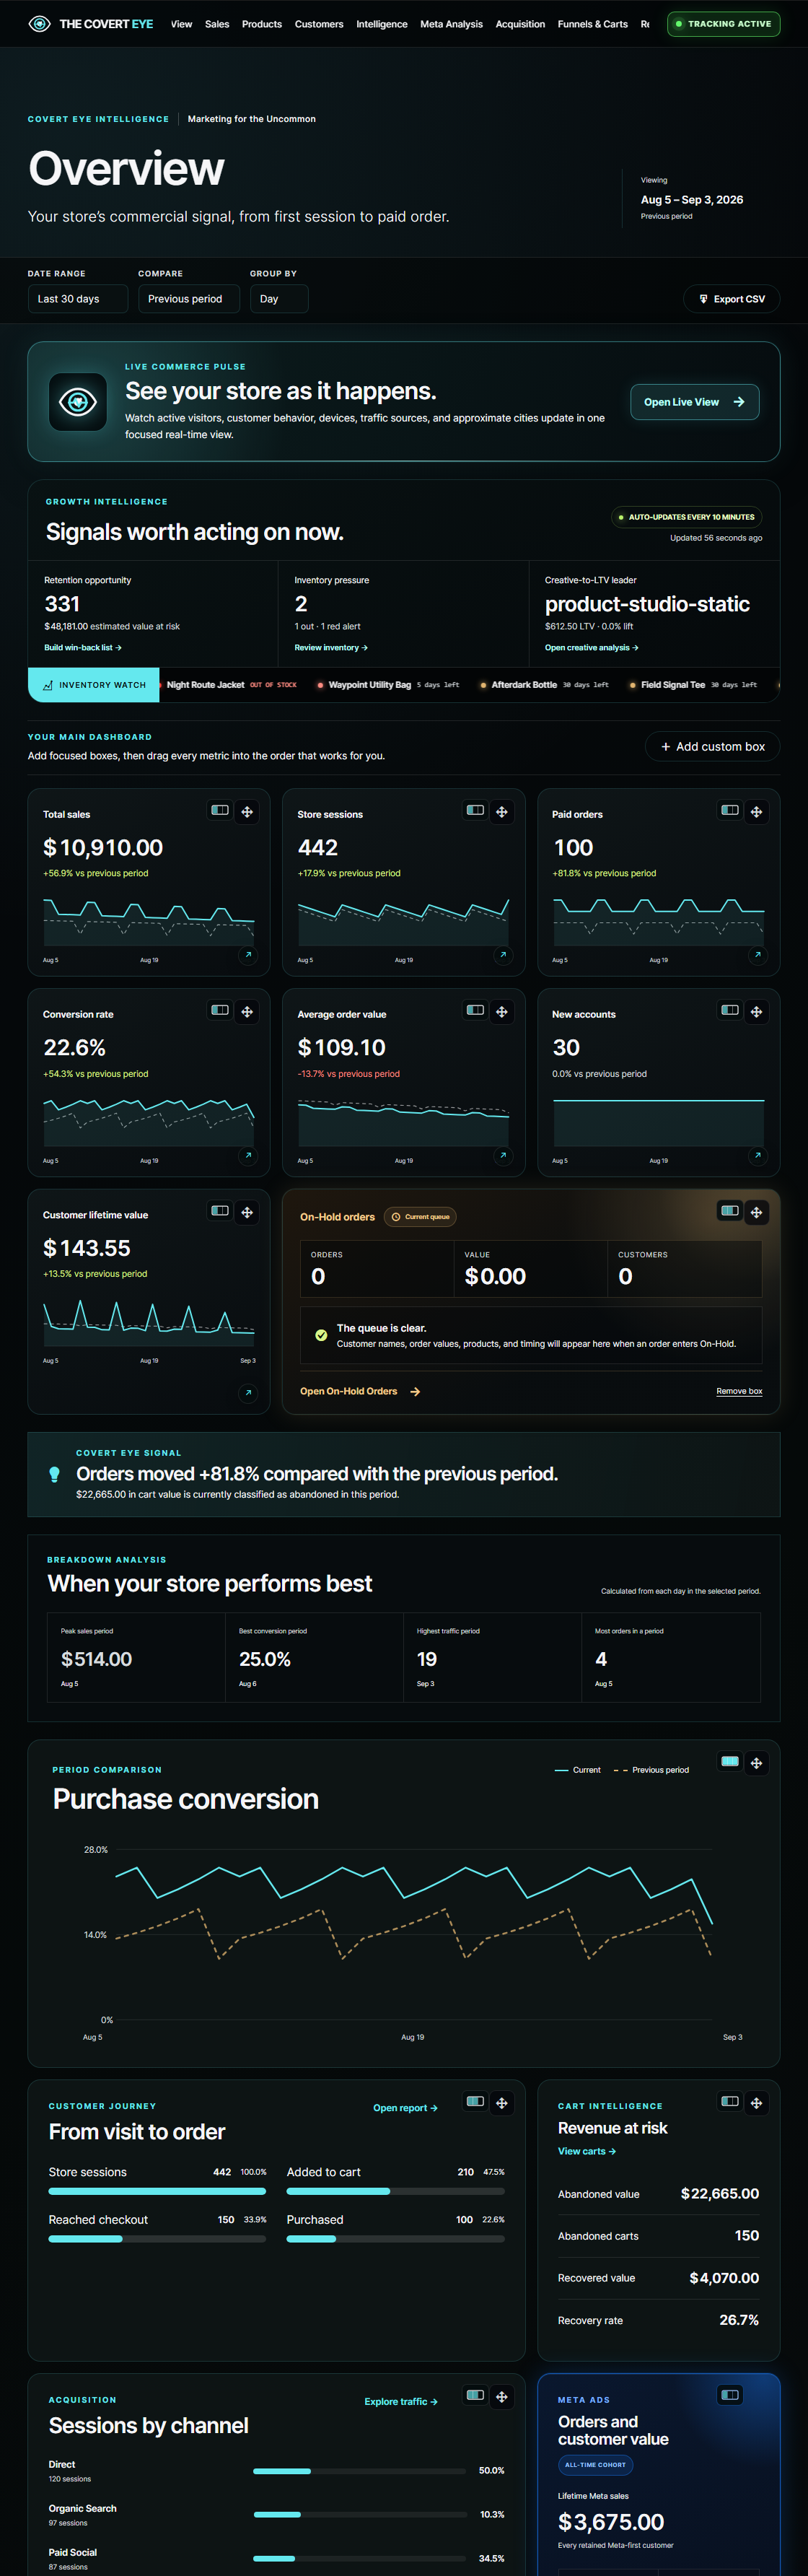
THE COVERT EYEPRODUCT EXPLORER01 / Overview
Your whole store.
One clear picture.
Bring sales, sessions, conversion, customer value, and inventory into the same workspace. See the headline numbers, then follow the detail behind them.
What needs my attention today?
Compare revenue and conversion with the previous period instead of reading isolated totals.
Reorder dashboard metrics and set targets around the things your team actually watches.
Move into dedicated reports for the products, people, and paths behind performance.
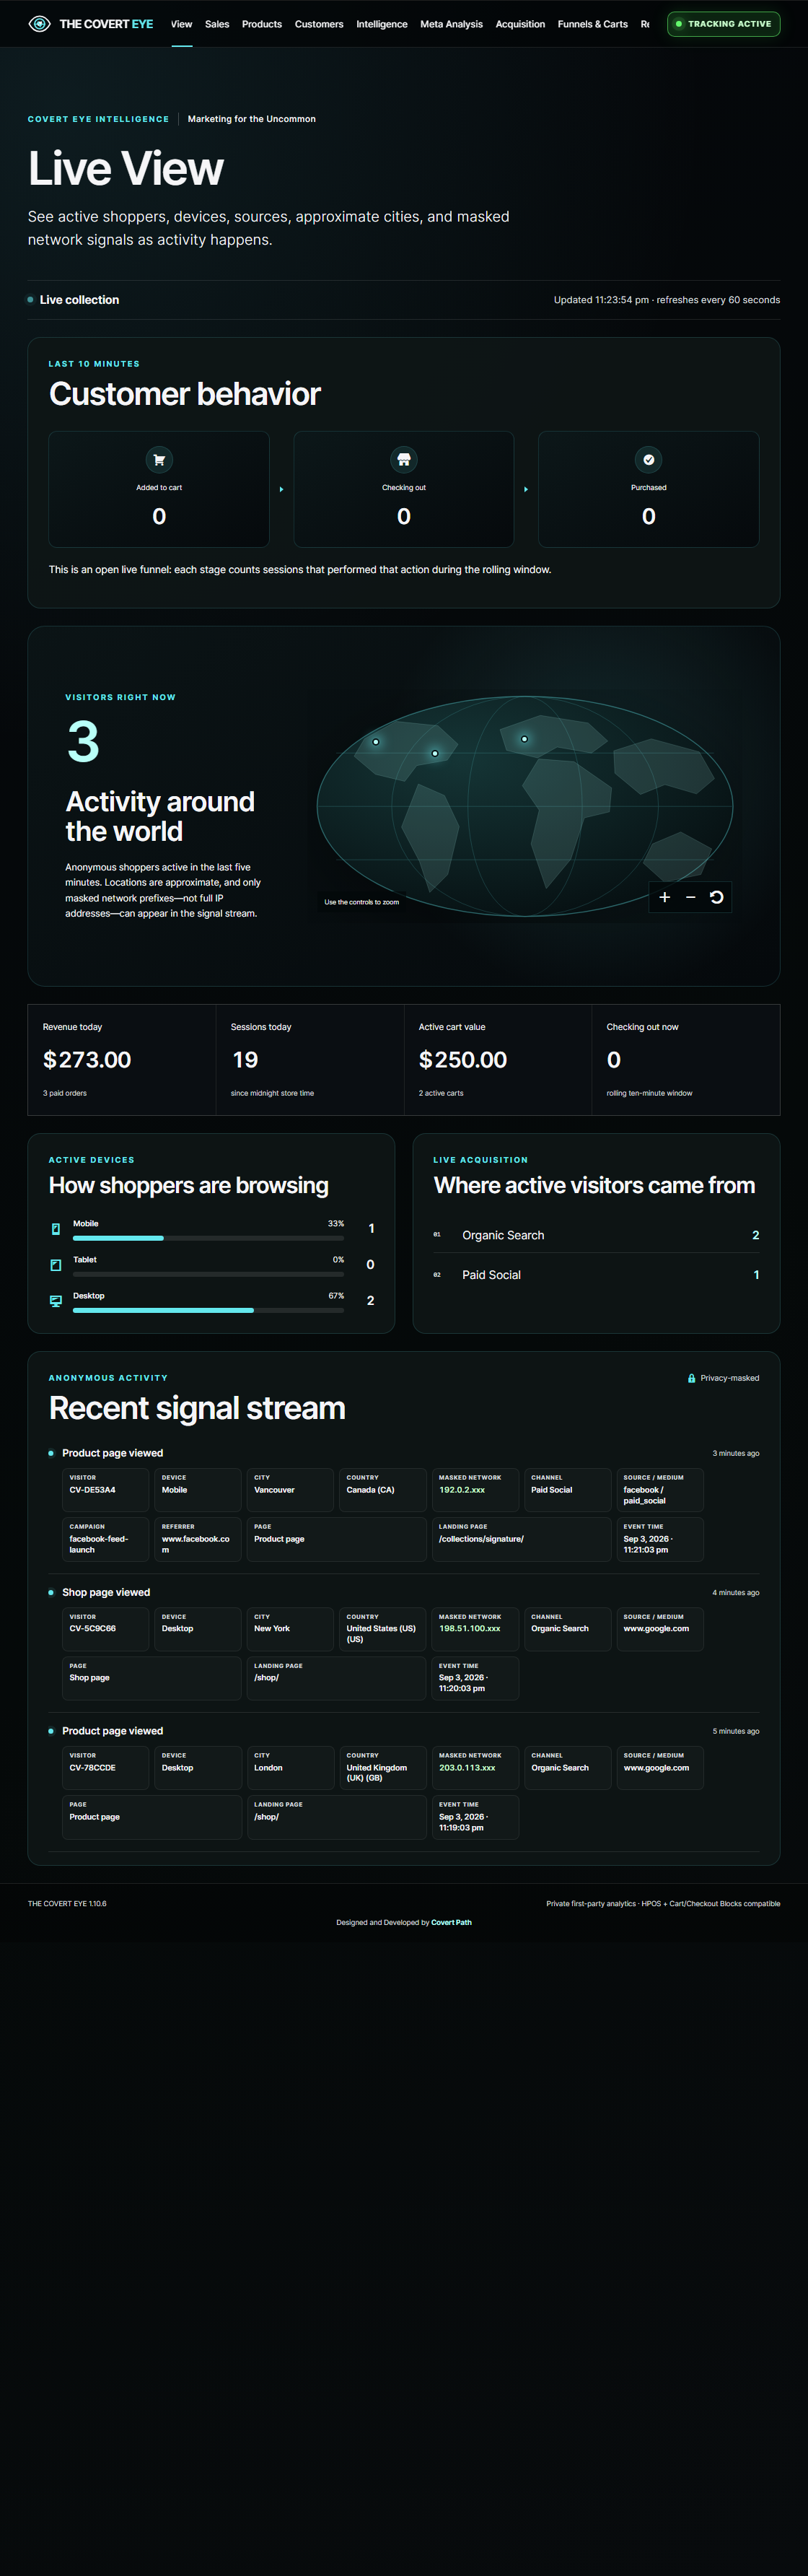
02 / Live View
See demand
as it happens.
Watch active sessions, devices, acquisition sources, approximate cities, and recent events. See what shoppers are doing now—not only what they bought yesterday.
What is happening in the store right now?
Follow rolling-window product, cart, checkout, and purchase activity.
Understand source and device mix alongside coarse location signals when enabled.
Use recent events and privacy-masked network context to investigate activity.
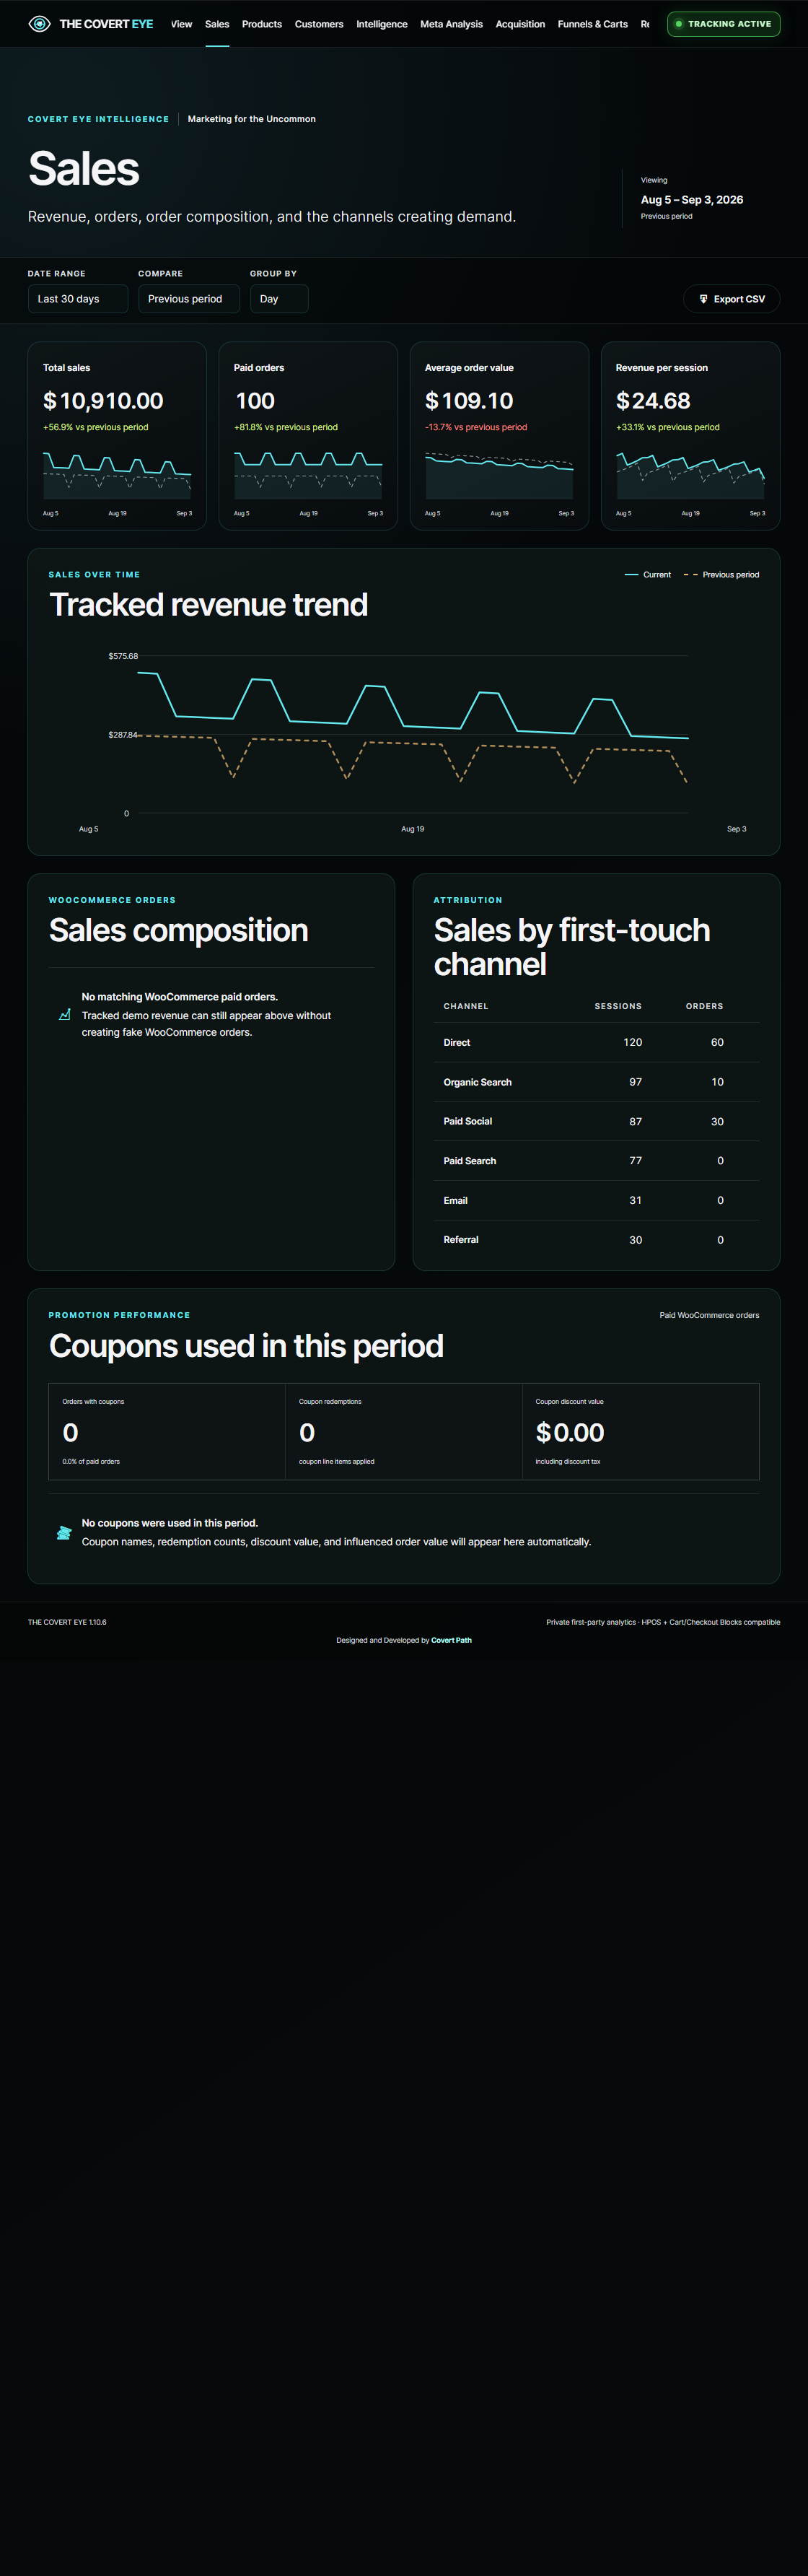
03 / Sales
Know what
creates revenue.
Follow sales, paid orders, average order value, and revenue per session. Compare periods and inspect the sources and commercial details behind the total.
Where is revenue coming from—and what changed?
Compare current and previous periods with interactive sales charts.
Review first-touch attribution and channel performance alongside paid orders.
Inspect coupons, discounts, refunds, shipping, and tax—not just top-line sales.
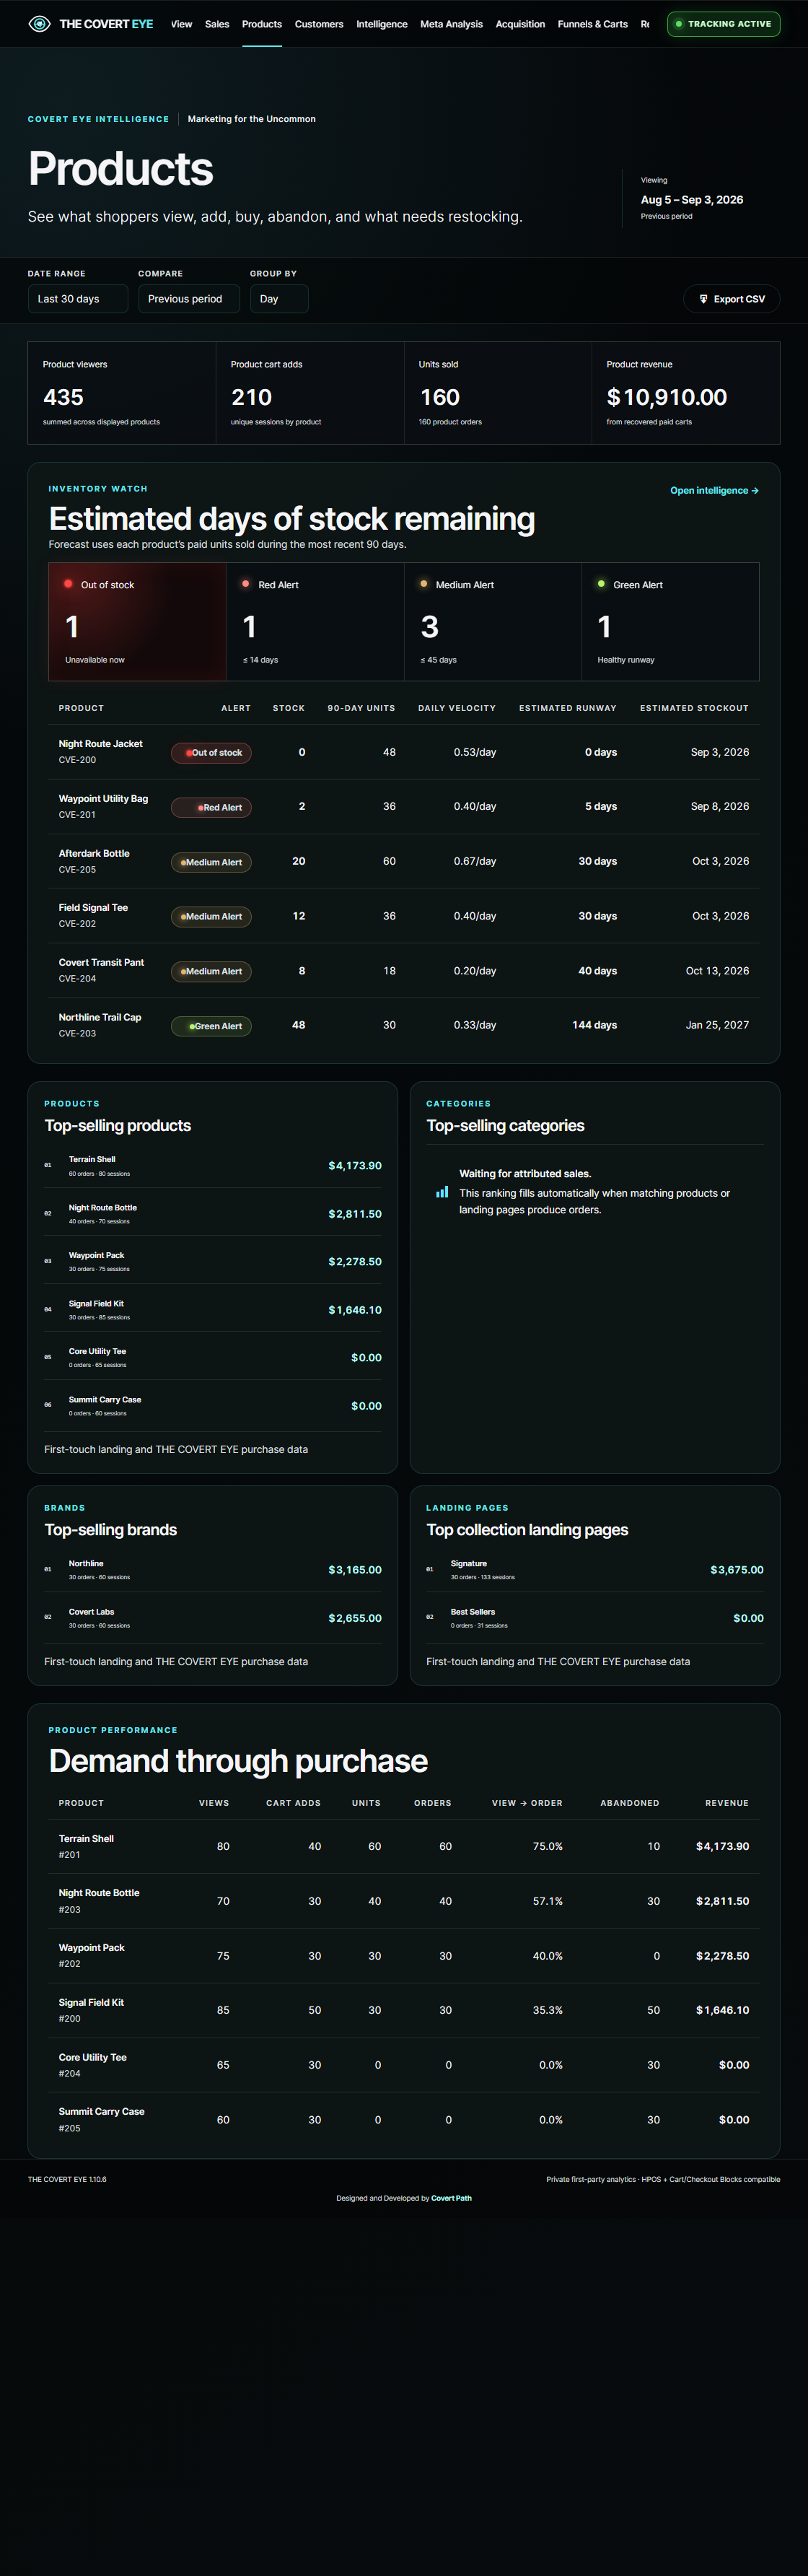
04 / Products
See the demand.
Protect the stock.
Connect product views, cart additions, paid orders, and managed inventory. Spot products that attract attention and products that may run out before their next opportunity to sell.
What should I restock before demand is lost?
Compare views, cart adds, purchases, and abandoned demand by product.
Estimate stock remaining from managed inventory and recent 90-day sales velocity.
Separate out-of-stock, red, medium, and healthy stock signals before reviewing product-level detail.
05 / Customers
The first order
is only the beginning.
Understand new and returning customers, repeat purchase behavior, and observed lifetime value. Group customers by their first purchase to see what happens after acquisition.
Are we acquiring one-time buyers or lasting customers?
Compare repeat rate, order history, and revenue per customer.
See each acquisition cohort’s observed lifetime orders and value.
Registered and anonymous first-party groups help connect activity without exposing a customer email in the analytics workspace.
Capability illustration · values are hypotheticalA customer is more than one conversion.
First-order cohort → subsequent paid orders → lifetime customer value
06 / Intelligence
Turn patterns
into a plan.
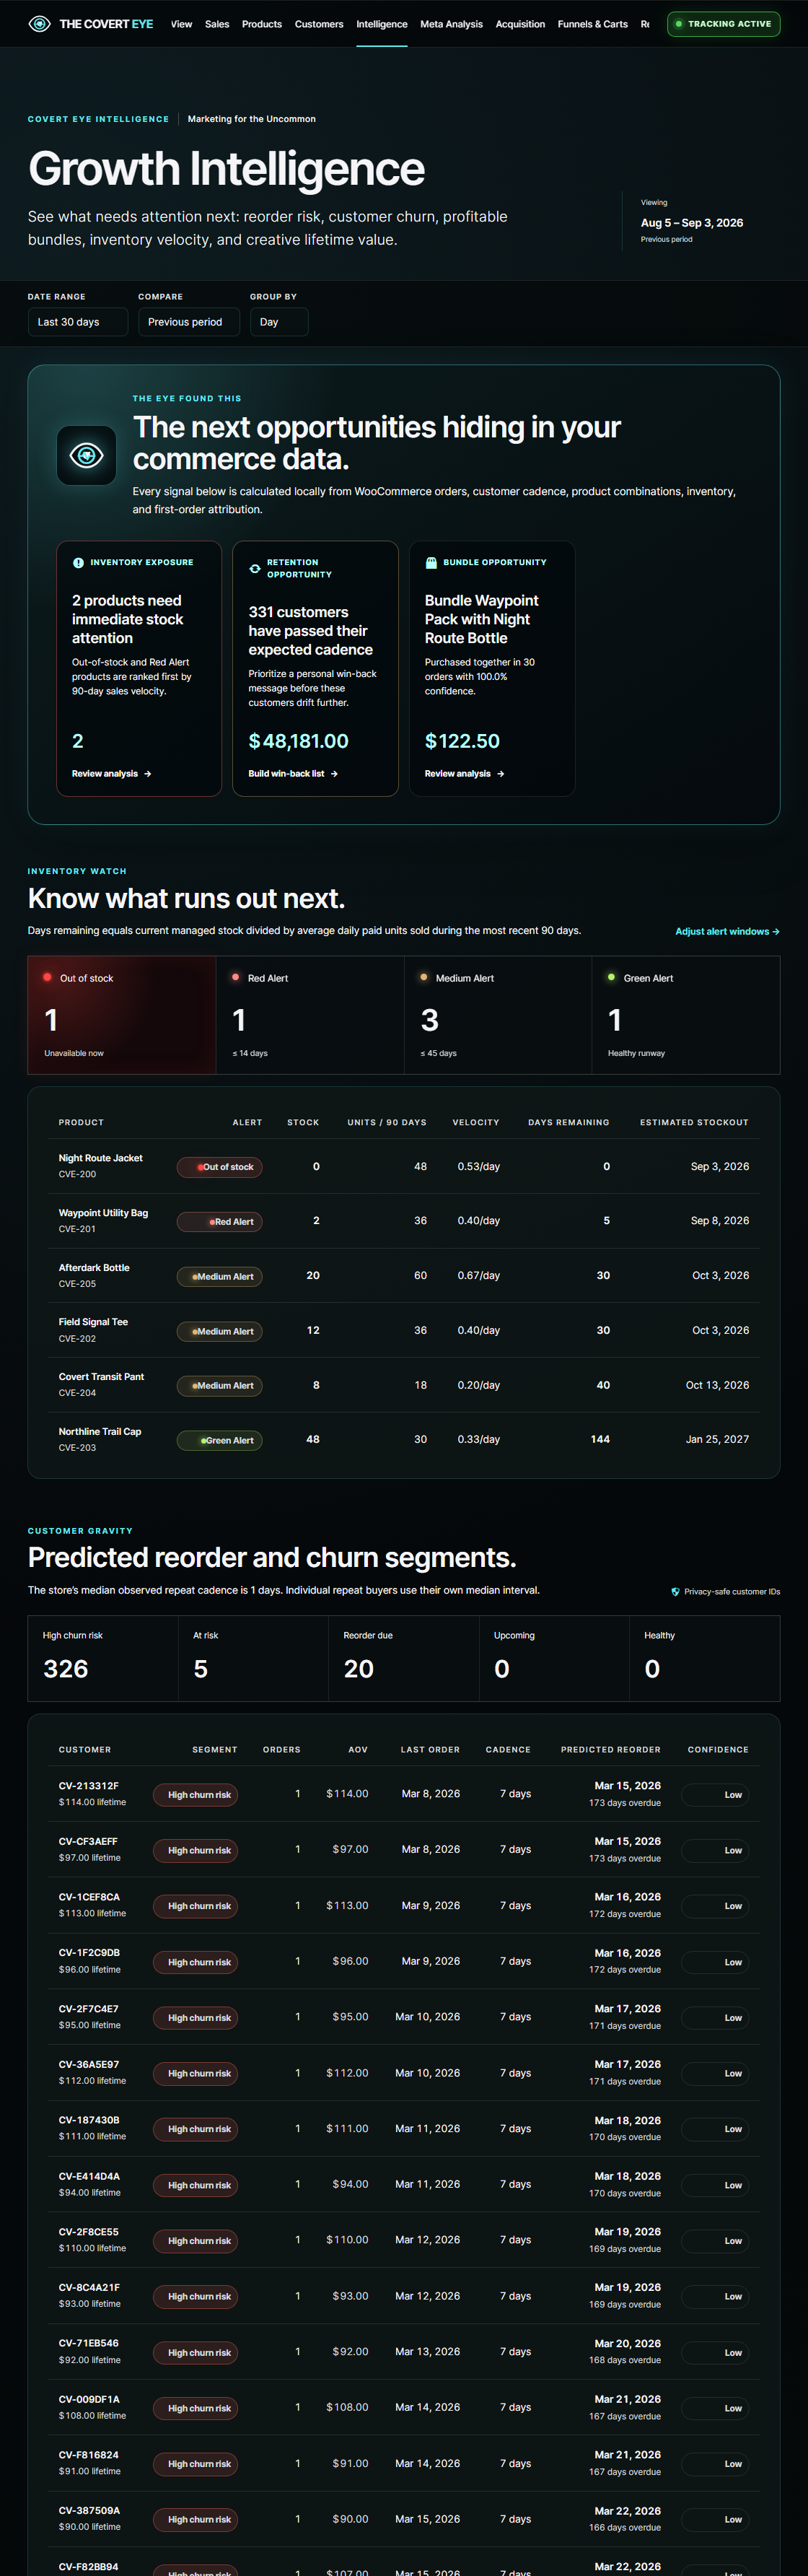
Bring inventory exposure, customer cadence, win-back segments, and product affinity into an operating queue. Recommendations make the next question easier to answer; your team decides what to do.
Where should the team act next?
Prioritize stock exposure using inventory and observed sales velocity.
Find customers beyond their expected purchase cadence and export a follow-up segment.
Use products purchased together to evaluate relevant bundles and cross-sells.
07 / Meta Analysis
Look past
the first conversion.
Group customers first acquired through Facebook or Instagram and see the paid orders they place afterward—even when they return through Direct, Email, or Search.
Which Meta-acquired customers keep creating value?
Facebook and Instagram referrals, campaigns, aliases, and click attribution can establish the cohort.
Subsequent paid orders remain in the cohort’s observed lifetime totals.
Compare lifetime revenue, returning rate, and average order value. This is customer-value analysis, not an ad-spend ROAS calculation.
Capability illustration · not a screenshotDifferent return paths. One customer story.
First-order source stays connected to the customer’s later paid orders.
08 / Acquisition
Trace the path
from source to sale.
Bring channels, UTM campaigns, referrers, and landing pages into the same view as sessions and purchases. Find the routes that bring attention—and the ones that turn it into revenue.
Which traffic deserves a closer look?
Read acquisition sources alongside downstream commercial performance.
Use captured UTMs and first-touch landing paths to understand the entry point.
Look at conversion and revenue together; traffic volume alone is not the verdict.
Capability illustration · not a screenshotFrom campaign context to commercial evidence.
Channel → UTM campaign → landing page → session → purchase
09 / Funnels & Carts
Find the friction
before the goodbye.
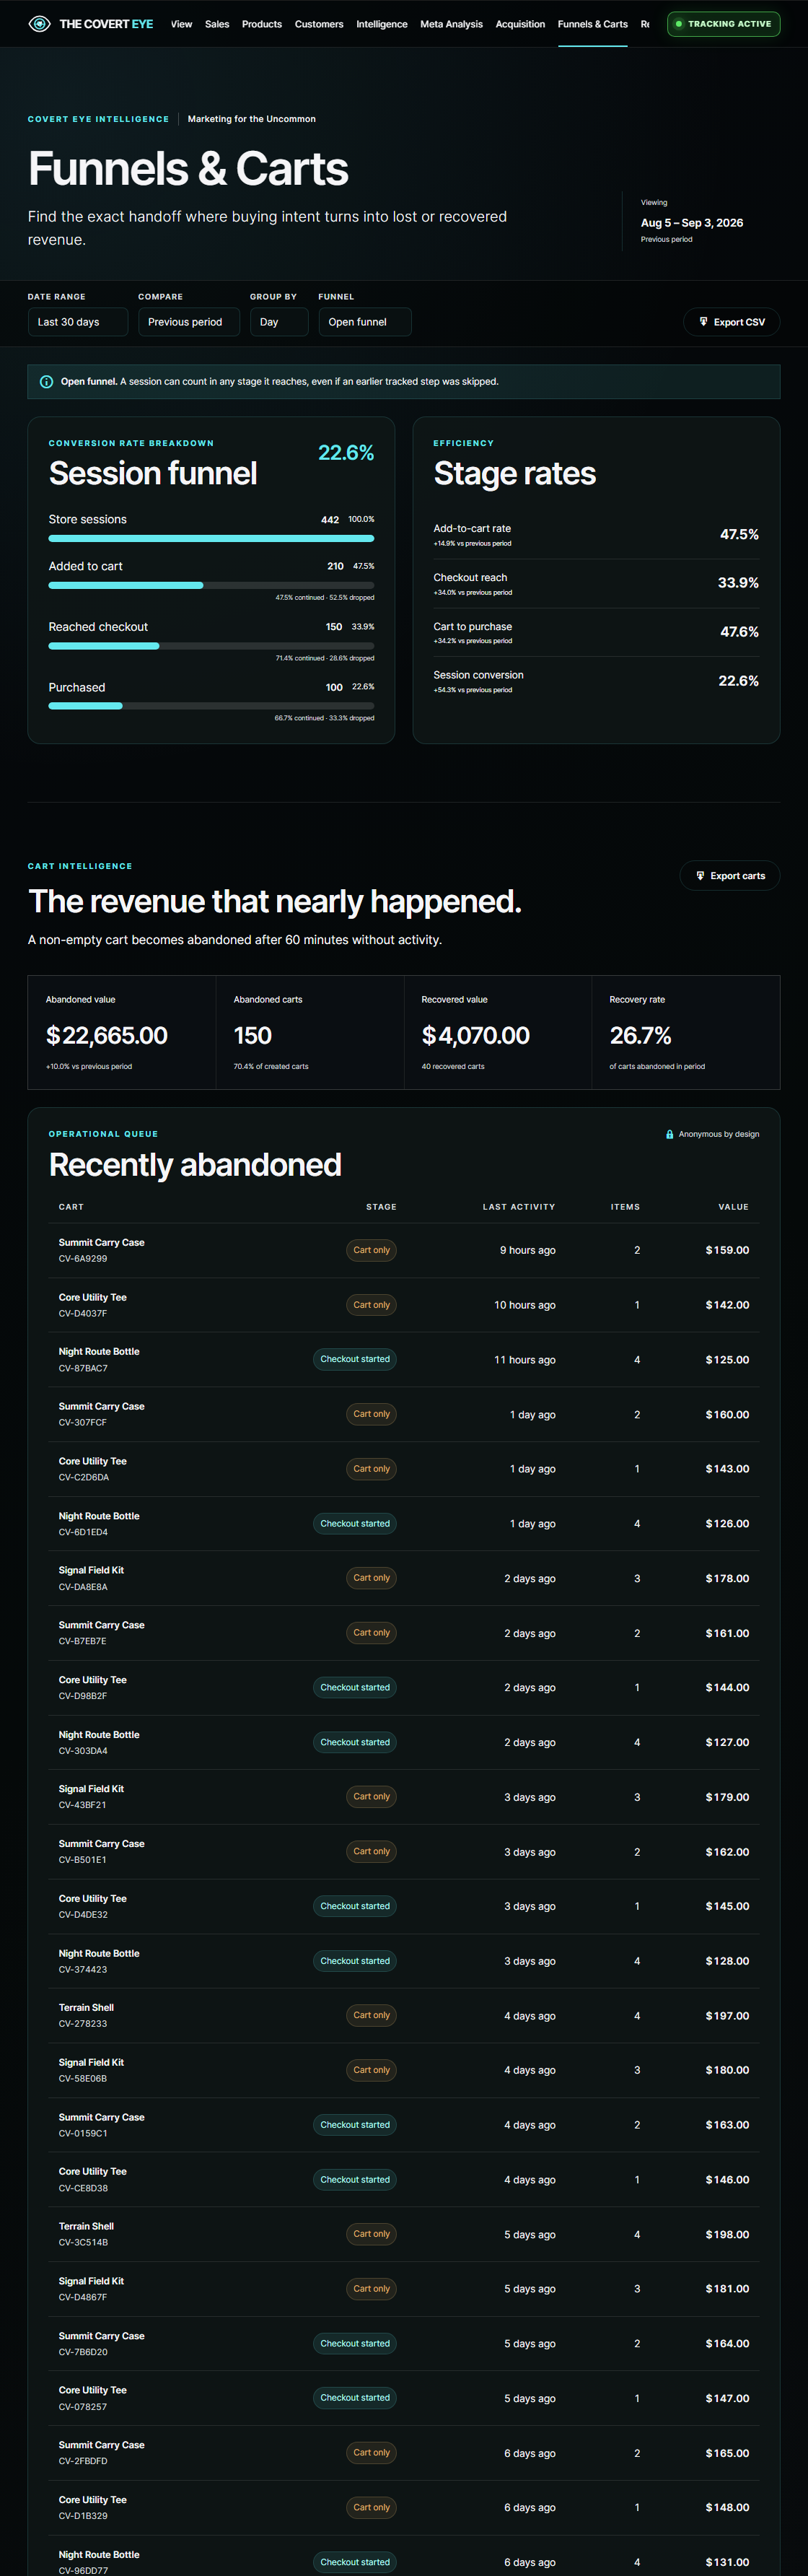
Follow the steps from product view to paid order. Compare open and closed funnels, inspect drop-off, and bring abandoned and recovered cart activity into a working queue.
Where do shoppers stop—and what is at stake?
Compare stage counts and conversion between product views, carts, checkout, and purchase.
Review abandoned value, recovered value, and cart-level detail.
Export and review the queue in your workflow. The plugin surfaces opportunities; it does not automatically send recovery campaigns.
10 / Reports
Start with a question.
Leave with the evidence.
A reporting directory connects sales, products, inventory, customers, acquisition, marketing, and behavior. Open the relevant analysis or export the selected period as CSV.
How do we bring the findings into the team’s workflow?
Choose a report by the operational question, not by searching through unrelated screens.
Carry the selected date range and comparison into the analysis.
Download available CSV reports for deeper work and sharing.
Capability illustration · not a screenshotSeven reporting categories. One connected workspace.
Choose a question → inspect the interactive report → export the period
11 / Settings
Built around
your WooCommerce store.
Sync eligible commerce history, configure tracking and privacy controls, and shape the dashboard around your team. Analytics are calculated locally in your WordPress installation.
How does this fit our store and our controls?
Sync eligible paid orders and product inventory through WooCommerce APIs, including HPOS-compatible order access.
Configure retention, Do Not Track handling, optional location signals, refresh intervals, and inventory alerts.
Historical orders can be reconciled. Browsing and funnel activity from before tracking was enabled cannot be recreated.
Capability illustration · not a screenshotYour store. Your data. Your controls.
WooCommerce-native · HPOS compatible · Cart & Checkout Blocks compatible
THE ADVANTAGE IS IN THE CONNECTIONS
Don’t just watch
your store.
Understand it.
For teams that want to know why a number moved, what it means, and where to look next.
Beyond traffic.
Customer value.
Connect acquisition sources with purchases, repeat behavior, and observed lifetime value.
Explore Meta AnalysisBeyond stock counts.
Demand in context.
Put managed inventory beside product performance and recent sales velocity.
Explore ProductsBeyond the first sale.
The next relationship.
Use purchase cadence and product affinity to investigate win-back and bundle opportunities.
Explore Intelligence04 / THE INVESTMENT
See more.
Decide better.
Move with intent.
The value isn’t another dashboard.
It’s knowing where to focus.
One connected plugin for the people responsible for revenue, inventory, acquisition, and customer growth.
BUILT BY COVERT PATHMarketing for the Uncommon.
The connected view your store deserves.
THE COMPLETE INTELLIGENCE WORKSPACE
- Overview & live shopper activity
- Sales, acquisition & campaign analysis
- Product performance & stock runway
- Customer cohorts & lifetime value
- Growth, win-back & bundle intelligence
- Meta-acquired customer lifetime analysis
- Funnels, abandoned & recovered cart analysis
- Reporting workspace & available CSV exports
- Commerce-history sync & privacy controls
Talk with COVERT PATH about your store, setup, and subscription details.
05 / BEFORE YOU LOOK INSIDE
Good questions.
Clear answers.
Still have a question about your store?
Talk to COVERT PATH
What does THE COVERT EYE actually do?
It is a WooCommerce analytics and intelligence plugin. It connects store activity, sales, products, inventory, acquisition, and customer history in dedicated workspaces, then surfaces patterns such as stock exposure, funnel drop-off, and repeat-purchase opportunities.
Will it use my existing WooCommerce data?
Yes. Eligible historical paid orders and product inventory can be synced in resumable batches. That history supports sales, customer, product, and inventory analysis. Browsing sessions and funnel events from before tracking began cannot be reconstructed.
Does it automatically send campaigns or place stock orders?
No. It surfaces analysis, recommendations, and available exports. Your team reviews the findings and takes action through its marketing and operational tools.
How are stock and customer recommendations calculated?
Inventory runway uses managed stock and recent 90-day paid-unit velocity. Customer opportunities use observed purchase history, cadence, and product combinations. These are estimates and signals to investigate—not guarantees of future sales or behavior.
Where does the analytics data live?
Store-level analytics are calculated locally in your WordPress installation. The plugin includes controls for retention, Do Not Track handling, optional coarse location, and privacy-masked network context. Review those settings against your store’s own consent and privacy requirements.
Are these real plugin screenshots?
Yes. The six dashboard captures show THE COVERT EYE 1.10.6 running with synthetic demonstration data. Each is a single continuous vertical capture, not a stitched composite. Additional feature illustrations are clearly labelled and explain capabilities; they are not screenshots or performance promises.
What does my site need?
The supplied 1.10.6 package lists WordPress 6.9+, PHP 7.4+, and WooCommerce 8.3+. It declares compatibility with WooCommerce HPOS and Cart & Checkout Blocks. Managed product inventory is required for numeric stock-runway estimates. Confirm fit with COVERT PATH before installation.
THE COVERT EYE / BY COVERT PATH
Your next move
is in the data.
Now you have a way to see it.
Let’s put it to work